nlmixr2 2.0.8 log-likelihood
By Matt Fidler and the nlmixr2 Development Team in nlmixr2
October 24, 2022
I am pretty excited abut the new nlmixr2 release (2.0.8). When I joined the the nlmixr2 team, I wanted to do a fancy heavy tailed, skewed model in an open source tool so I could figure out how to do even more with it.
With this release, it is possible to do a heavy tailed (t-distribution dt()) skewed (coxBox(lambda)) distribution: my old wish is now possible with focei!
A few other things that people may be interested in are:
Likelihood based each observation (and how to get it)
Standard Errors for etas (and how to get it)
More robust dose-based between subject variability (lag time, bioavailability, modeled rate/duration)
These will all be discussed in other posts (since this one is long already).
Testing Generalized Likelihood
With any new method I want to the results makes sense.
With that in mind, I thought I could use the models Rik used to compare the SAEM and FOCEi algorithms to Monolix and NONMEM, respectively (1) to check the generalized likelihood.
In these tests, we can modify the error model to use generalized likelihood by adding a + dnorm() to the end of the residual specification. This allows us to run a generalized likelihood and compare it to the compare the current focei .
As discussed in Rik’s paper, every model has estimated a central volume. So simply looking at Vc and how it behaves is a good surrogate of how well this method is doing.
First, we will compare the population estimated Vc values between the methods and against the true value of 70:
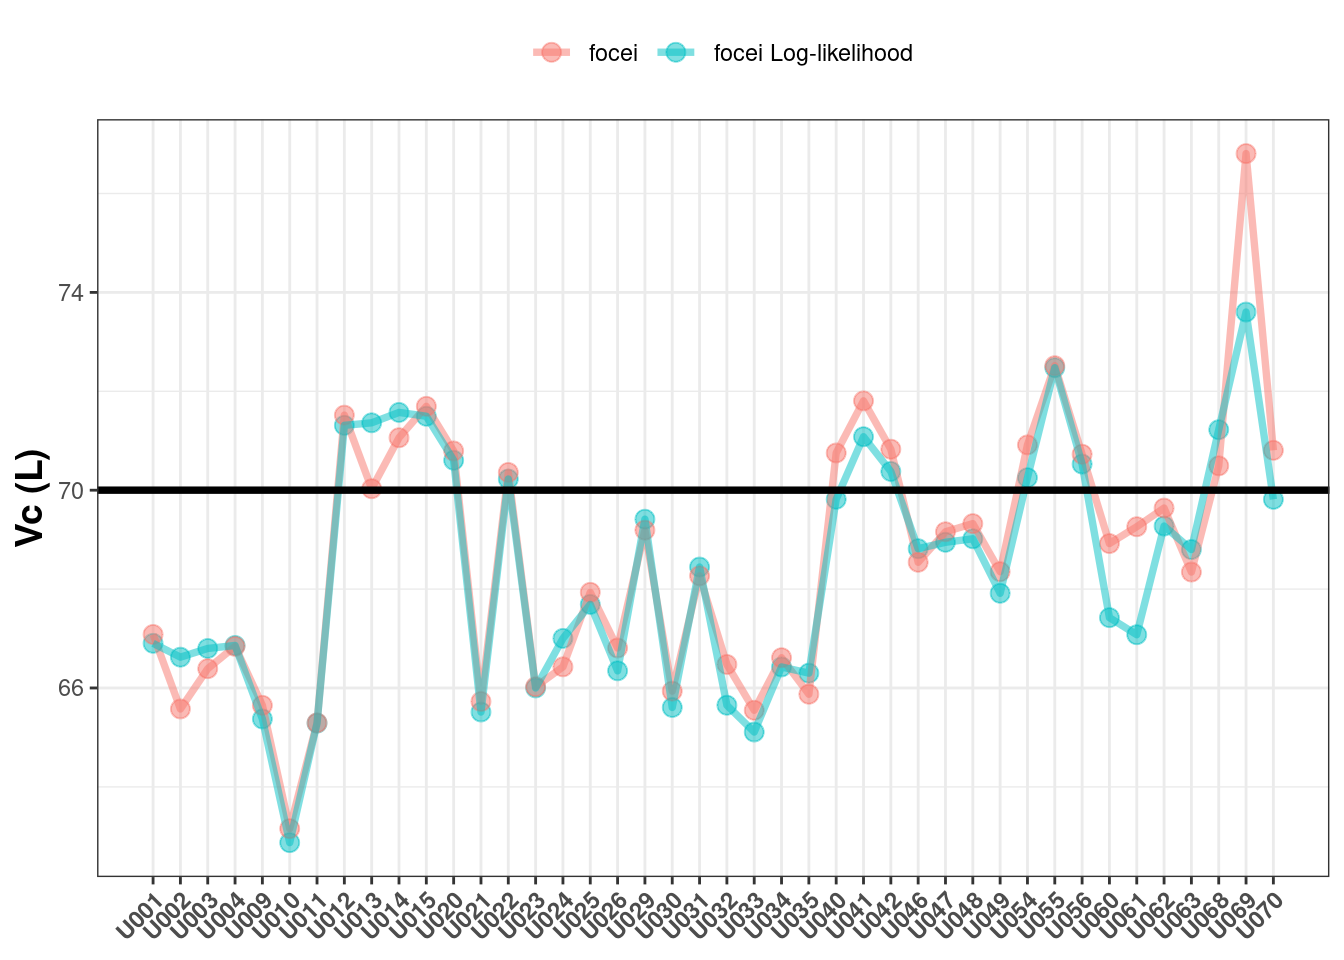
In my estimation, the Vc values are similar between the two methods and both vary (similarly) around the true value of 70. Incidentally both Monolix and NONMEM give similar findings here (1).
The next parameter to check is the between subject variability on Vc where the true value is 30%CV:
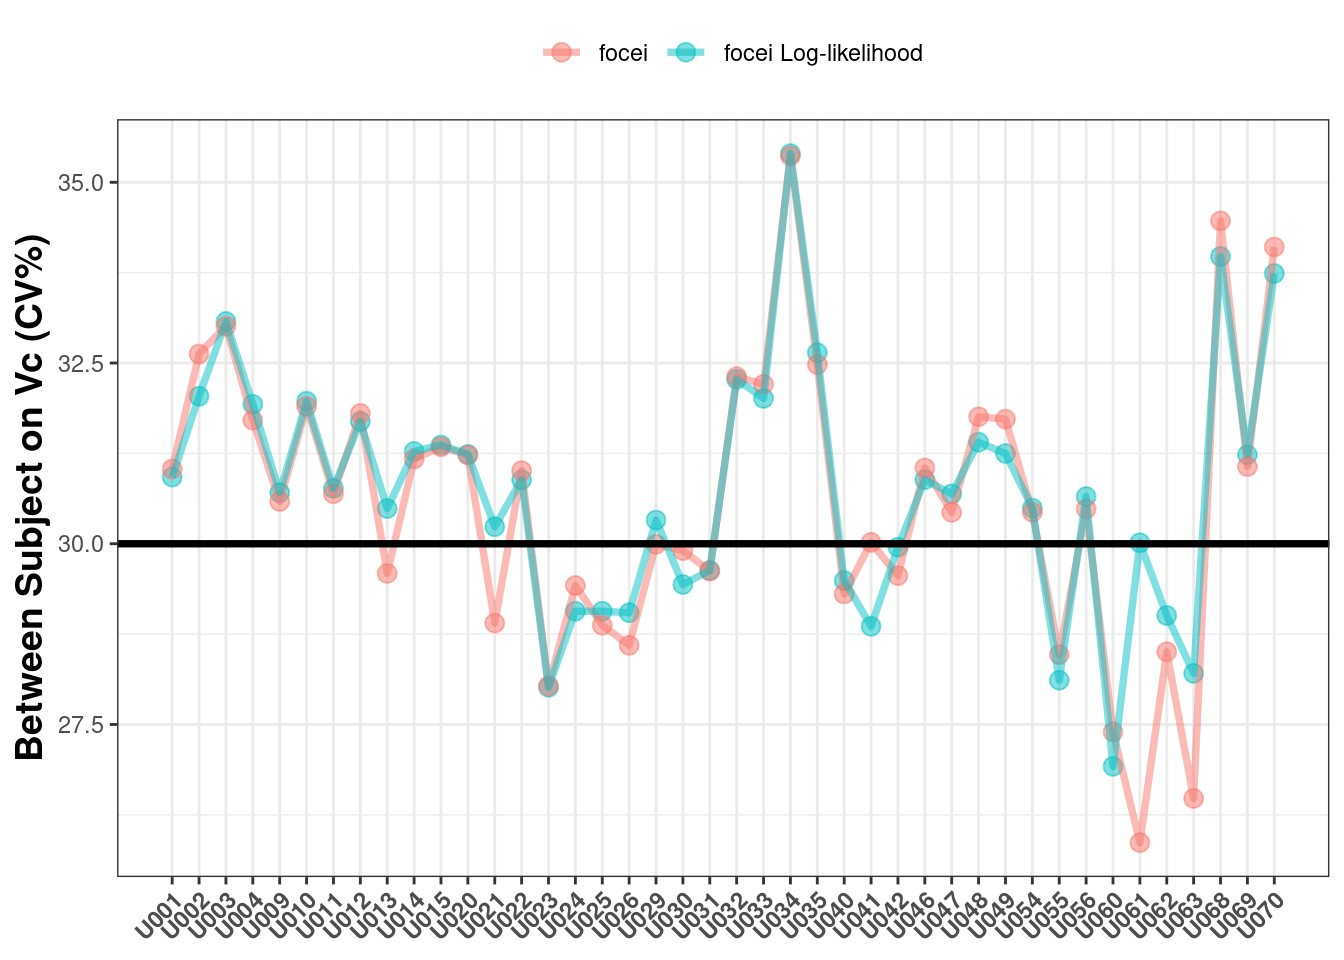
The estimates here also look fairly consistent (and reasonable).
Now lets examine the standard errors of the estimates:
## Warning: Removed 6 rows containing missing values (geom_point).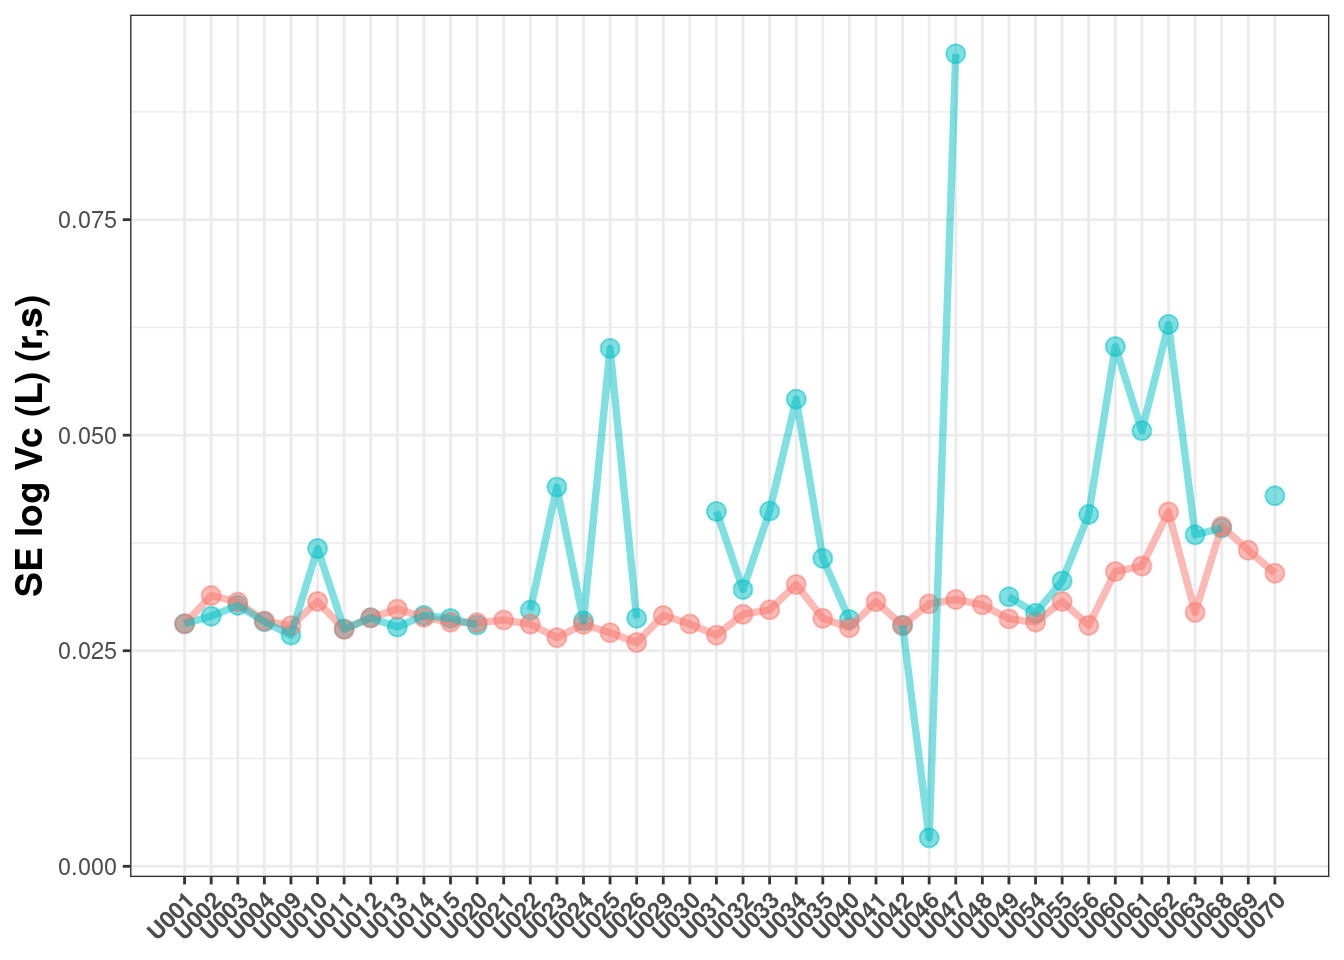
Here you can see:
The results are similar, but often higher for the log-likelihood estimation
The log-likelihood estimation is less likely to have a successful covariance (as measured by a
r,smatrix)
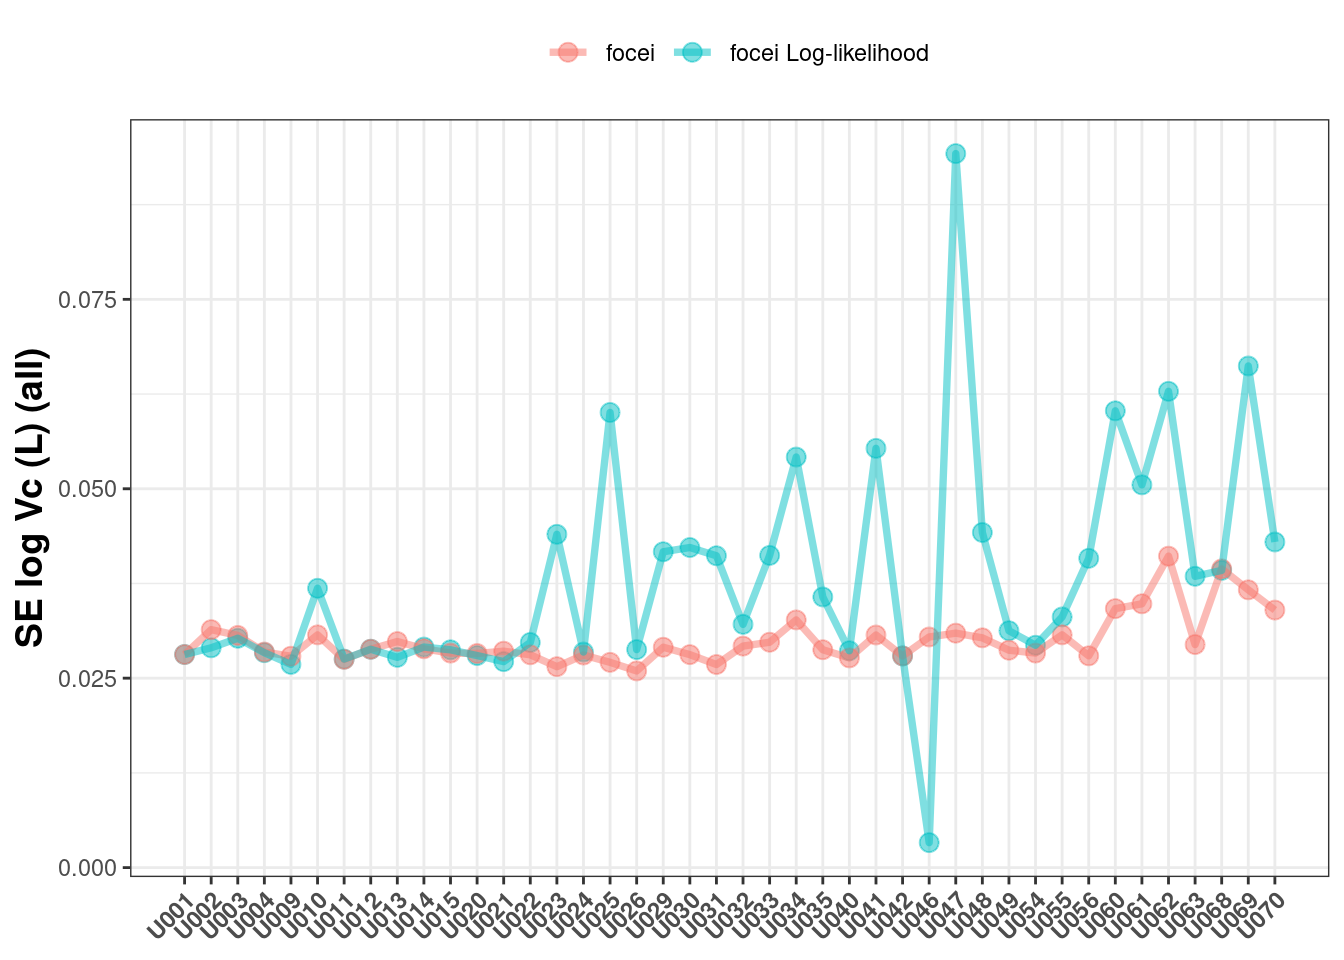
If you allow all the covariance types returned, you can see a similar pattern:
The next question is how much (longer) does it take to run nlmixr2 with log-likelihood than with a standard normal model
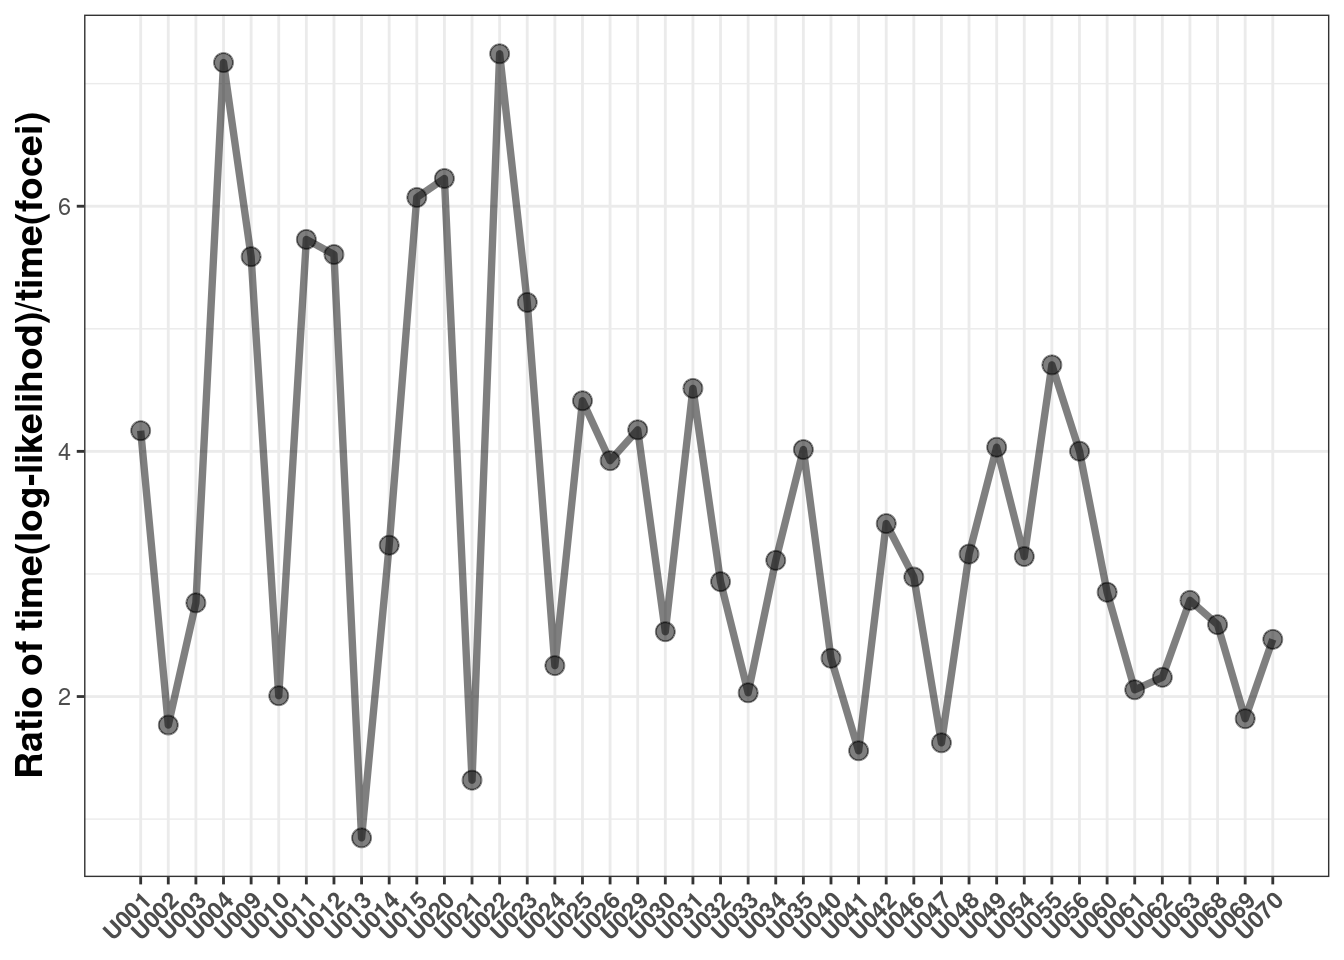
This shows it takes anywhere from 0.8 to 7.2 fold longer to use the log-likelihood method than the standard focei method with these datasets.
This is because each individual has to estimate the eta Hessian numerically for each subject to calculate the overall objective function. The time difference is likely a function of:
number of between subject varaibilities estimated
number of subjects in the data-set
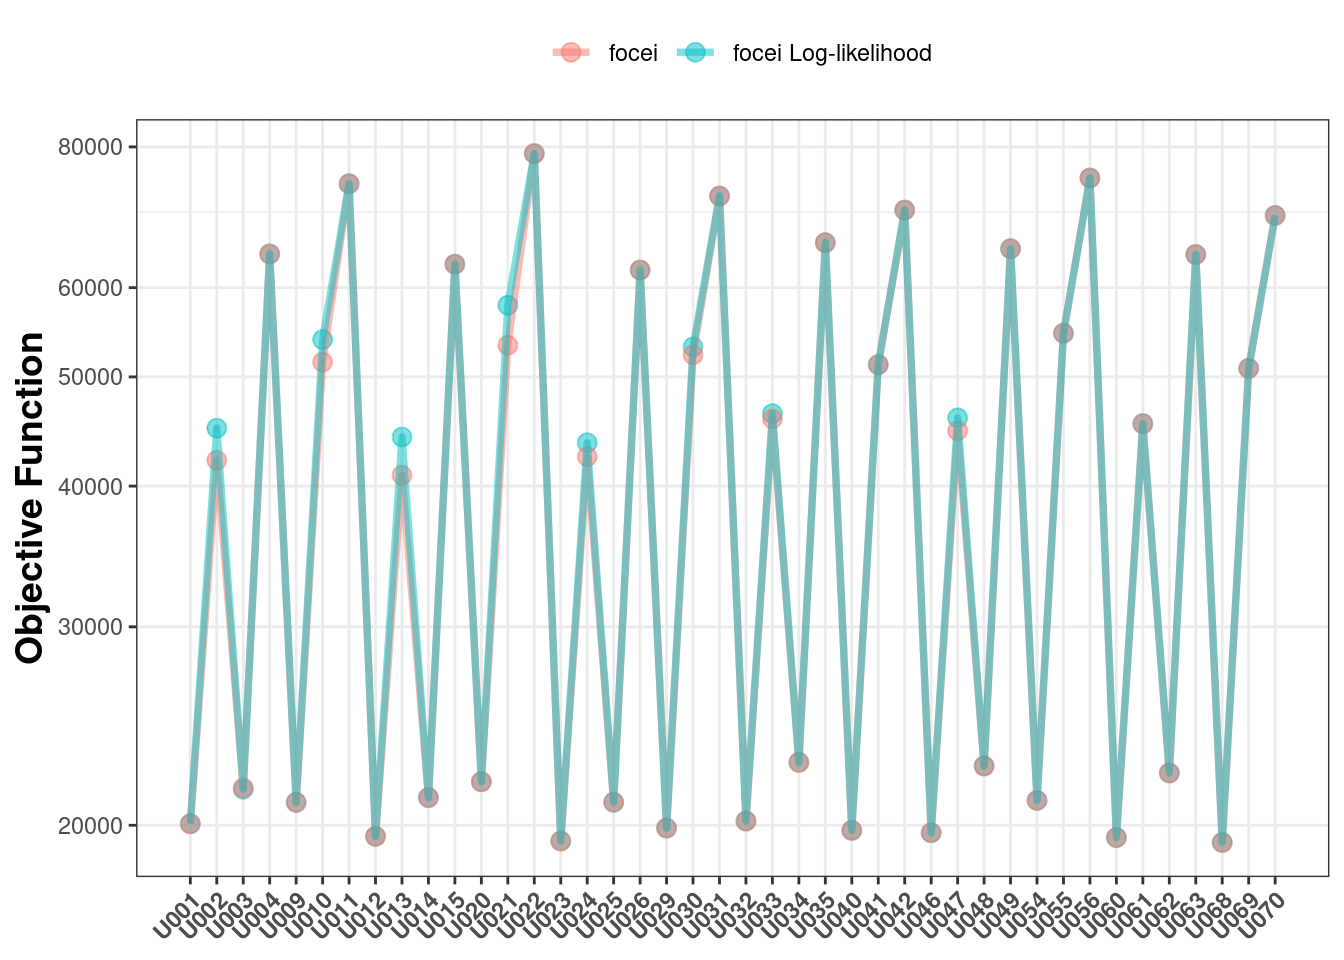
NOTE: Because the log-likelihood focei calculation is different than using the NONMEM approximation of the individual Hessian (as described by Almquist 2015 (2)), you should not do statistical comparisons between a log-likelihood model and a standard focei model; The calculations are different, and it is not clear that the differences are due to likelihood alone.
That being said, the generalized log-likelihood method does approximate the same likelihood as the NOMMEM-style focei. Hence, plotting the objective functions between the two methods give very similar values for each problem:
Overall Conclusions about nlmixr2 log-likelihood focei
The log-likelihood estimation procedure performs well for estimating population effects and between subject varaibilites
The log-likelihood estimation procedure does provide standard error estimates that are in the right general area, but tend to be a bit larger than the true values.
The procedure takes more time (0.8 to 7 fold more)
You should not compare objective functions between models that were estimated by general focei and log-likelihood focei.
Generalized likelihood methods in nlmixr2
More distributions
These (mostly) match all match the R distributions in the function. The left handed side of the equation (err) represent the compartment name for the DV in the dataset (if needed). It still needs the compartment defined even if it is a single endpoint model.
The only function that does not exactly the R documentation is the dnbinomMu probability function. It takes the size and mu as documented below and in the R documentation.
| Distribution | How to Add |
|---|---|
| Poision | err ~ dpois(lamba) |
| Binomial | err ~ dbinom(n, p) |
| Beta | err ~ dbeta(alpha, beta) |
| Chisq | err ~ chisq(nu) |
| Exponential | err ~ dexp(r) |
| Uniform | err ~ dunif(a, b) |
| Weibull | err ~ dweibull(a, b) |
| Gamma | err ~ dgamma(a, b) |
| Geom | err ~ dgeom(a) |
| Negative Binomial | err ~ dnbinom(n, p) |
| Negative Binomial (mu version) | err ~ dnbinomMu(size, mu) |
Ordinal
Finally, ordinal likelihoods/simulations can be specified in 2 ways, the first is:
err ~ c(p0, p1, p2)Here err represents the compartment and p0 is the probability of being in category:
| Category | Probability |
|---|---|
| 1 | p0 |
| 2 | p1 |
| 3 | p2 |
| 4 | 1-p0-p1-p2 |
It is up to the model to ensure that the sum of the p values are less than 1. Additionally you can write an arbitrary number of categories in the ordinal model described above.
It seems a little off that p0 is the probability for category 1 and sometimes scores are in non-whole numbers. This can be modeled as follows:
err ~ c(p0=0, p1=1, p2=2, 3)Here the numeric categories are specified explicitly, and the probabilities remain the same:
| Category | Probability |
|---|---|
| 0 | p0 |
| 1 | p1 |
| 2 | p2 |
| 3 | 1-p0-p1-p2 |
Generalized likelihood
The generalized log-likelihood can be defined as follows:
ll(err) ~ log likelihood expressionHere err represents the compartment or dvid that specifies the log-likelihood. You still need to specify it even if it is a single endpoint model (like the distributions above).