Welcome
Why nlmixr?
The goal of nlmixr, or more accurately nlmixr2, is to support easy and robust nonlinear mixed effects models (NLMEMs) in R.
NLMEMs are used to help identify and explain the relationships between drug exposure, safety, and efficacy and the differences among population subgroups. Most often, they are built using longitudinal PK and pharmacodynamic (PD) data collected during clinical studies. These models characterize the relationships between dose, exposure and biomarker and/or clinical endpoint response over time, variability between individuals and groups, residual variability, and uncertainty.
NLMEM development in the pharmaceutical space is dominated by a small number of proprietary, commercial software tools. Although this kind of approach to software has some advantages, adopting an open-source, open-science paradigm also has benefits - third-party auditing or adjustments are possible, and the precise model-fitting methodology employed can be determined by anyone with the time and energy to review the source code. We see nlmixr2 being especially useful in being able to integrate into the rich R ecosystem, and it is well suited for use in scripted, literate-programming workflows of the kind flourishing in the R ecosystem by means of packages such as knitr and rmarkdown.
The nlmixr2 blog
Open Source in Regulatory Review: nlmixr2 Developers Meet Regulators
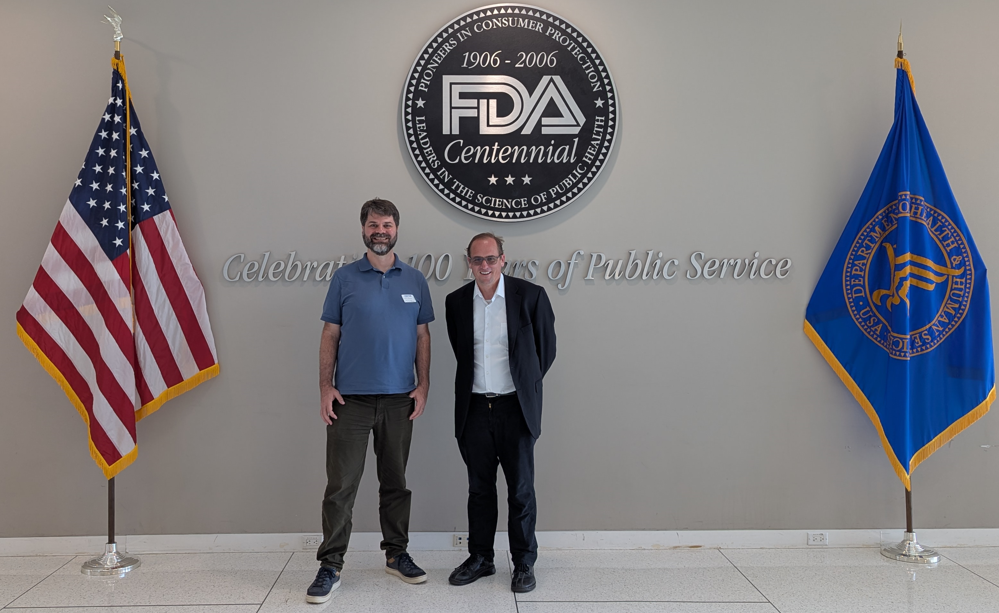
The nlmixr2 development team, represented by Bill Denney, Lisa Hendricks, and I (Matt Fidler), recently gave a invited seminar to the FDA quantitative clinical pharmacology reviewers to discuss nlmixr2 and how open, community-built modeling tools can be helpful in regulatory settings. The conversation was constructive and forward-looking, and a clear theme emerged: anything that lets regulatory reviewers trust, reproduce, and exchange models across tools would be very useful. As we go through these reflections, I must add that these are my takeaways and are not necessarily the views of the FDA, nor are they necessarily the views of the companies or individuals represented by the nlmixr2 working group, or the R Consortium.
Read more